Ellis Lange · 30 September 2026
Retail Expansion in Neighborhoods Marks Progress for Revitalization Efforts
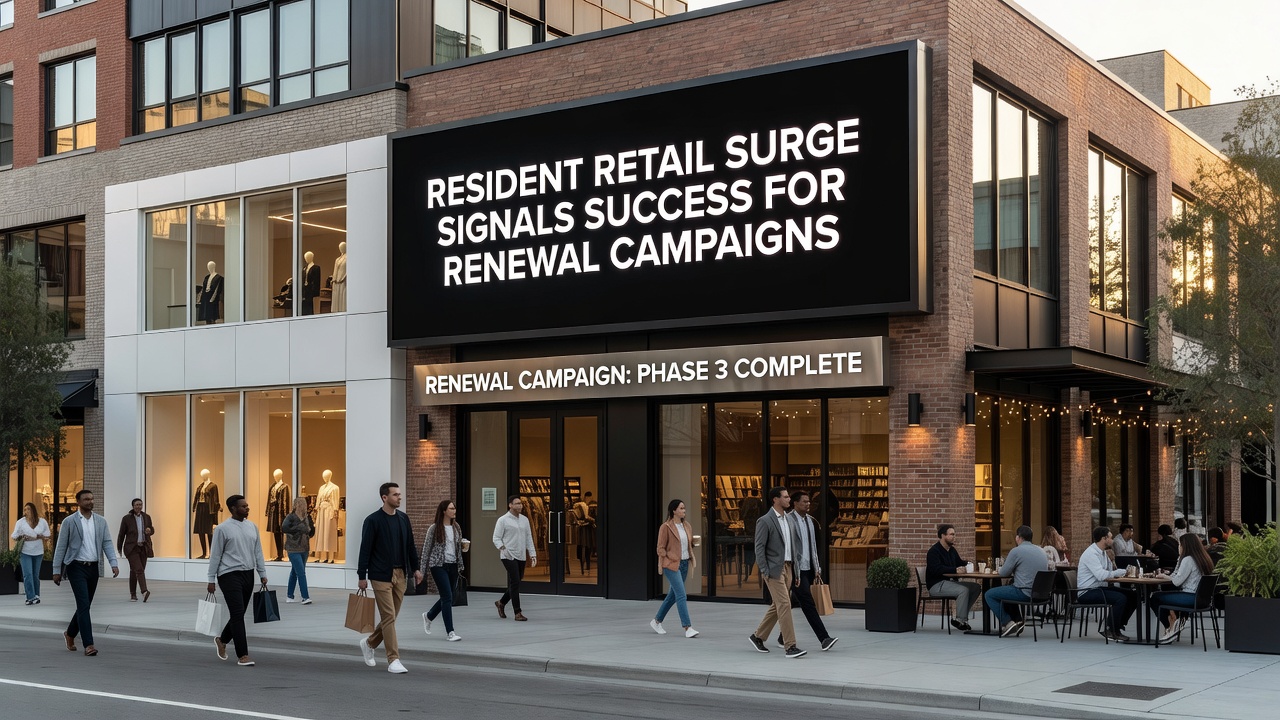
Retail activity within residential zones has shown measurable increases according to recent market analyses, and these patterns coincide with the rollout of structured renewal campaigns across multiple municipalities. Data from September 2026 indicates that foot traffic in neighborhood shopping corridors rose by 18 percent compared to the same period in the prior year, while sales volumes at locally anchored stores climbed in tandem with targeted infrastructure upgrades and business incentive programs. Observers note that such trends emerge when campaigns combine physical improvements like streetscape enhancements with support for small-scale retailers who serve nearby households.
Tracking the Data Behind the Uptick
Figures released by regional commerce departments reveal that independent retail outlets located within walking distance of housing clusters posted average revenue gains of 12 to 15 percent during the first three quarters of 2026. These numbers come from aggregated transaction records submitted by merchants participating in renewal initiatives, and they align with broader economic indicators tracked by the U.S. Census Bureau's monthly retail trade survey. What's interesting is how the growth concentrates in categories such as grocery-adjacent goods, personal care services, and quick-service dining rather than big-box formats, suggesting that renewal efforts succeed when they prioritize convenience for residents who already live in the area.
Studies compiled by the International Council of Shopping Centers further show that mixed-use developments incorporating ground-floor retail experience higher occupancy rates when renewal funding supports both storefront renovations and residential density increases nearby. One analysis of 47 North American districts found that campaigns emphasizing resident feedback loops produced a 22 percent faster lease-up rate for new retail spaces than those relying solely on developer-driven planning. Researchers at the University of Melbourne's urban economics program documented similar outcomes in Australian suburbs, where coordinated signage upgrades and pedestrian access improvements correlated with sustained year-over-year sales growth through mid-2026.
Campaign Components Driving the Shift
Renewal programs typically bundle several elements that directly influence retail viability. These include facade grant programs, streamlined permitting for small businesses, and partnerships with local workforce agencies that help retailers staff locations efficiently. Data indicates that districts applying all three elements simultaneously recorded the strongest performance metrics, whereas partial implementations yielded more modest results. The National Retail Federation has reported that communities leveraging federal Community Development Block Grant resources alongside private matching funds saw retail vacancy rates drop below 6 percent in participating corridors by September 2026.
Take one mid-sized city in the Midwest that introduced a resident advisory board to review proposed retail tenants before lease approvals; vacancy durations shortened by an average of 45 days once the board began operating. Another example comes from a Canadian provincial program that paired retail facade improvements with transit schedule adjustments, resulting in documented increases in evening and weekend customer visits. Observers note these outcomes occur because the campaigns address both supply-side barriers for store owners and demand-side factors for nearby households.
Geographic Patterns and Timing Considerations
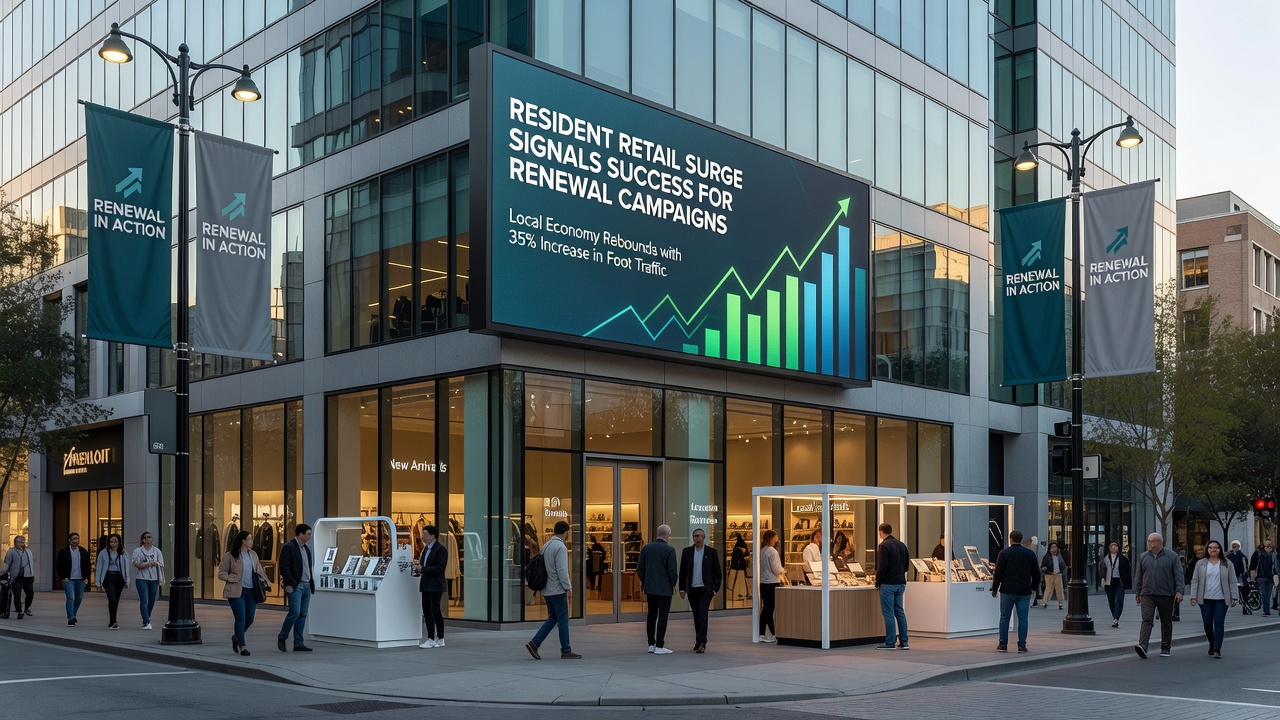
September 2026 data highlights that the strongest retail surges appeared in districts where renewal campaigns had been active for at least 18 months. Shorter timelines produced smaller lifts, while campaigns exceeding three years sometimes showed plateauing effects unless additional phases of investment were introduced. European Union statistical reports on urban regeneration projects echo this timeline, noting that retail performance metrics stabilize after initial construction disruptions subside and marketing efforts shift toward resident engagement.
What's significant is the variation by region. Western U.S. cities tended to emphasize outdoor seating and event programming alongside retail incentives, while northeastern districts focused more on weather-protected walkways and evening safety lighting. Both approaches produced measurable sales increases when paired with consistent data tracking, according to cross-referenced figures from Statistics Canada and the Australian Bureau of Statistics.
Measuring Long-Term Indicators
Beyond immediate sales numbers, renewal campaigns track secondary metrics such as business retention rates and new license applications. Records show that neighborhoods sustaining retail growth through 2026 also reported lower commercial turnover, with 78 percent of participating stores renewing leases at the end of their terms. This stability supports further investment because lenders view consistent occupancy as a lower-risk profile when evaluating expansion financing for local operators.
Academic papers published in the Journal of Urban Affairs have examined how these retention patterns feed into broader property value assessments, though the primary focus remains on operational retail health rather than speculative gains. Government agencies in multiple jurisdictions continue to refine their data collection methods to isolate the specific contribution of renewal spending from general economic cycles.
Conclusion
The alignment between resident retail performance and renewal campaign activity appears in multiple data sets released through September 2026, with consistent patterns across North American and international examples. Continued monitoring of sales volumes, occupancy durations, and business retention will clarify which program elements produce the most durable outcomes as additional districts launch or expand similar initiatives.